
May 18, 2013
Overview
New User Interface
Project Dashboard ChartsProject Dashboard is now available in UI3 with Charts.
Display finer level of detail in Pie charts
Additional settings give more control over the display of Pie charts.
New chart types
Donut, Area Spline, Stacked Area, Horizontal stacked-bar, and Vertical stacked-bar chart types are now available.
Details ...
Projects
Check all on Projects Phases/Tasks WorksheetCheck all feature allows project managers to quickly close completed tasks.
Details ...
Timesheets
Role permission to view all time entries for project approversPermission to allow project approvers to see all the hours worked on a timesheet.
Details ...
Reports
Filter by revenue container approval statusReports and custom calculations can be filtered by revenue container status.
Additional filters for Advanced Pending Billings report
Options are available to allow filtering for specific types of pending billings.
Details ...
Details
New User Interface
The phased rollout of the new user interface will begin with this release.Note: NetSuite OpenAir UI3 includes functionality provided by HighCharts JS software, which is owned by and licensed through Highsoft Solutions AS.
Project Dashboard Charts
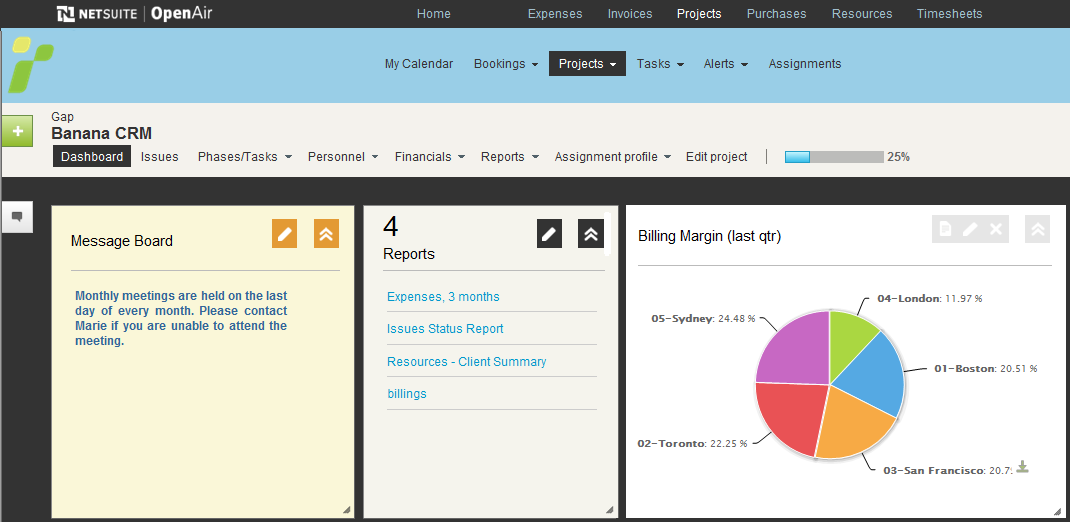
The Project Dashboard is now available in UI3 and with the power of Charts. This gives a visual analysis of a specific project and is useful for visually comparing projects.
Note: All items displayed on the Project Dashboard are filtered by the specific project. Only saved reports with the "Make this report available in project-specific situations" option selected are shown in the Reports portlet and available to create Charts.
Display finer level of detail in Pie charts
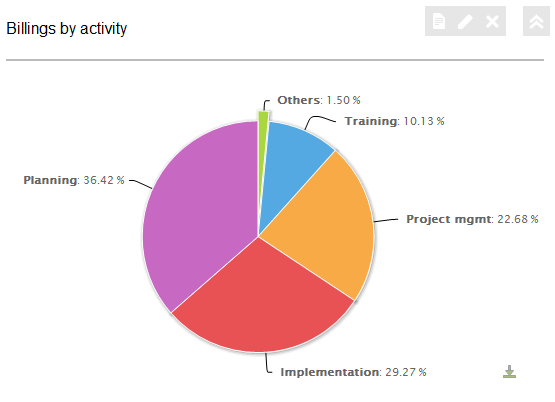
Additional settings are provided to give more control over the display of Pie Charts:
- Less than 10% values are not automatically grouped into the Other slice
- Up to 50 slices can now be displayed in Pie Charts
This is useful for customers that need to see the details that make up less than 10% of the total.
New chart types
Donut
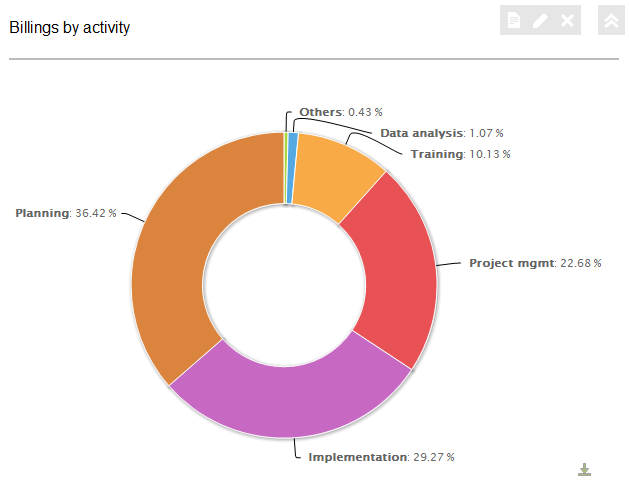
A Donut chart is a type of Pie chart. It shows a break-down into categories and their relative sizes.
Area Spline
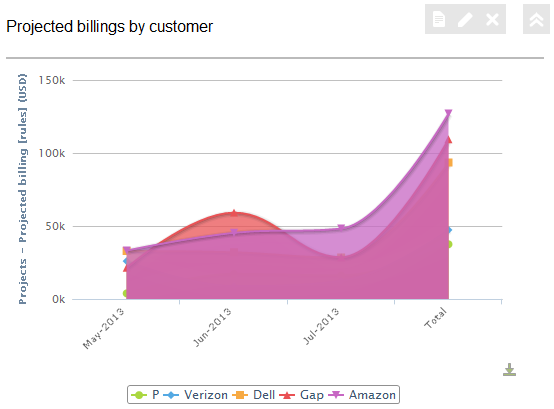
The Area Spline chart plots a fitted curve through each data point in a series. It emphasizes the degree of change over time and shows the relationship of the parts to a whole.
Stacked Area
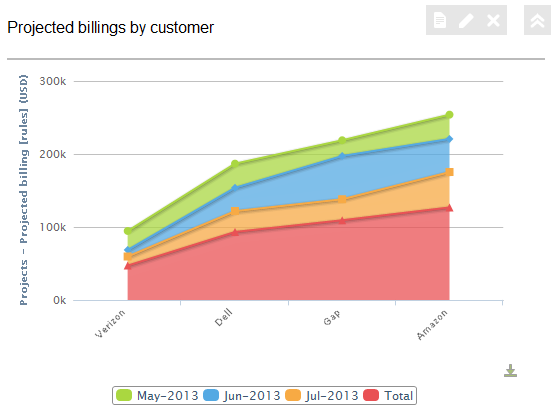
The Stacked Area chart displays the trend of the contribution of each value over time or other category data.
Horizontal stacked-bar
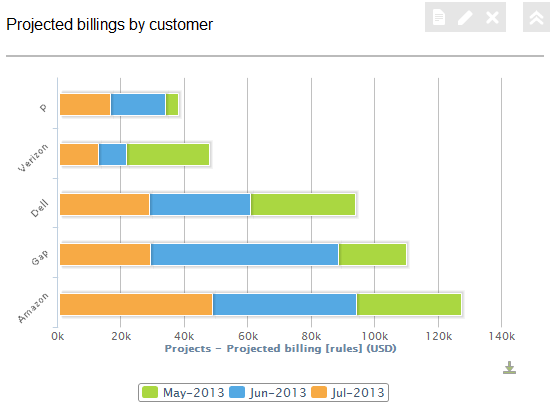
The Horizontal stacked-bar chart compares the parts to the whole. The bars are divided into categories where each bar represents a total. See also the Vertical stacked-bar chart.
Vertical stacked-bar
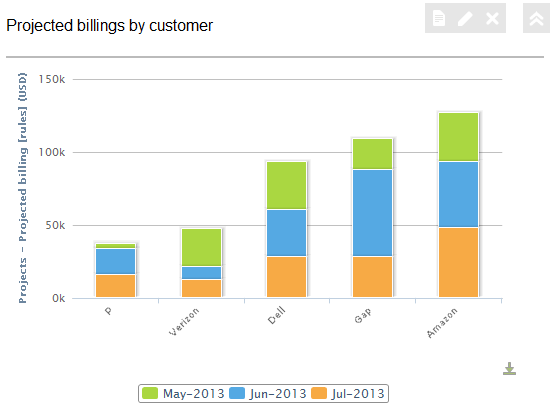
The Vertical stacked-bar chart compares the parts to the whole. The bars are divided into categories where each bar represents a total. See also the Horizontal stacked-bar chart.
Projects
Check all on Projects Phases/Tasks Worksheet (UI2)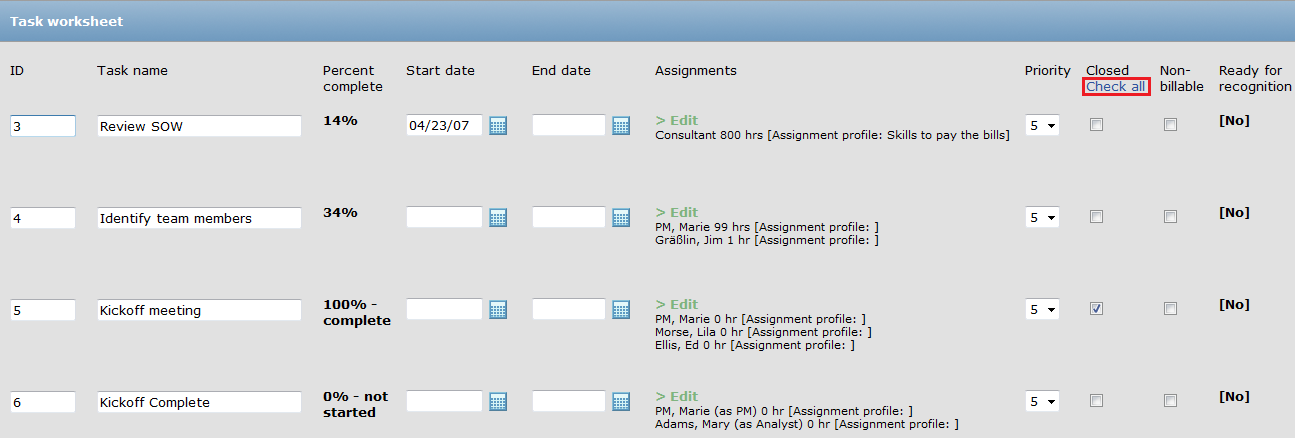
In UI2, a "Check all" option is available at the top of the "Closed" column. Click "Check all" to check all the closed boxes with a single click.
Note: When the "Check all" link is clicked it is replaced with an "Uncheck all" link. Click the "Uncheck all" to uncheck all the closed boxes with a single click.
Check all on Projects Phases/Tasks Worksheet (UI3)
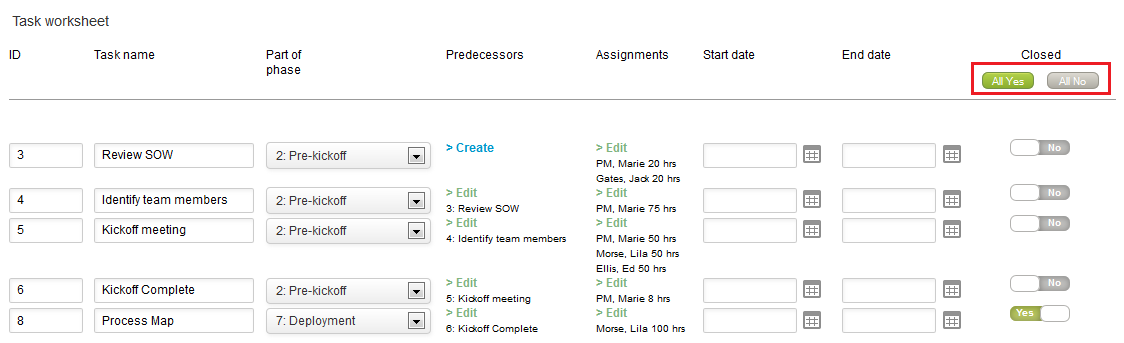
In UI3, "All Yes" and "All No" buttons are available at the top of the "Closed" column. Click "All Yes" to mark all the tasks, "Yes" for closed, with a single click.
Timesheets
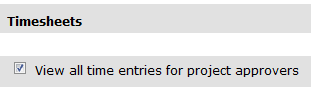
Role permission to view all time entries for project approversThis new timesheet permission can be assigned to a role to allow project approvers to see all the hours worked on a timesheet and not just those being approved for a particular project.
For example, consider the case where a company is using some customers as approvers and also has its own internal approvers. The company does not want its customers to see all the hours worked on a timesheet, but its own approvers need to see all the hours worked. This can be controlled by setting the "View all time entries for project approvers" role permission for its own internal approvers and leaving this unset for its customers.
The new permission can be assigned on the Administration -> Global Settings -> Roles screen.
Reports
Filter by revenue container approval statusThere is now the option to filter by revenue container approval status in custom calculations. There are the following statuses: Approved, Submitted, Open, and Rejected.
Users can add these calculations to their reports.
For example, this allows a customer to run reports at the end of the month to see how much revenue has been approved versus was is still sitting in an unapproved status.
This feature is available in the Account-wide summary reports and Invoice Summary reports.
Additional filters for Advanced Pending Billings report
The following additional filters are available for the Advanced Pending Billings report: Service, Rule type, Charge type, Expense item, and Product.
For example, this allows reports to be created for specific types of pending billings and allows customers to run cost analysis on a more frequent and timely basis.
To enable the additional filters for the Advanced Pending Billings report, please contact NetSuite OpenAir Support.
To contact our support team, please create a support ticket. We take pride in the outstanding care we give our customers. Please let us know how can we improve your experience with NetSuite OpenAir.